STOCKS WITH BUY SIGNAL
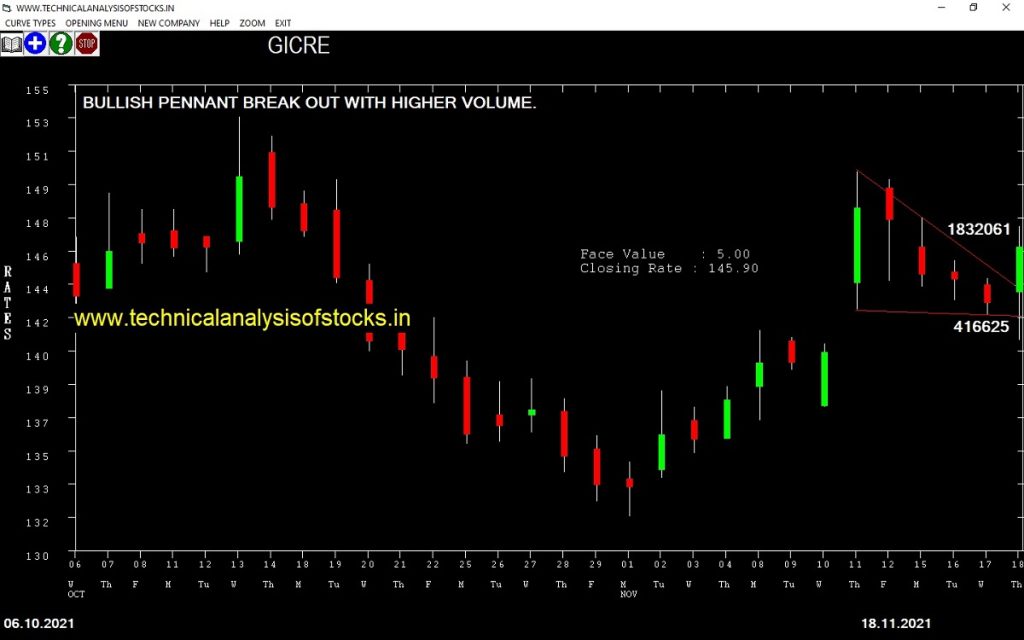
GICRE (NSE Code) Signal : Bullish pennant break out with higher volume. Buy Above : 147 Stop Loss : 132.30 Target : 159.30 (Short term)
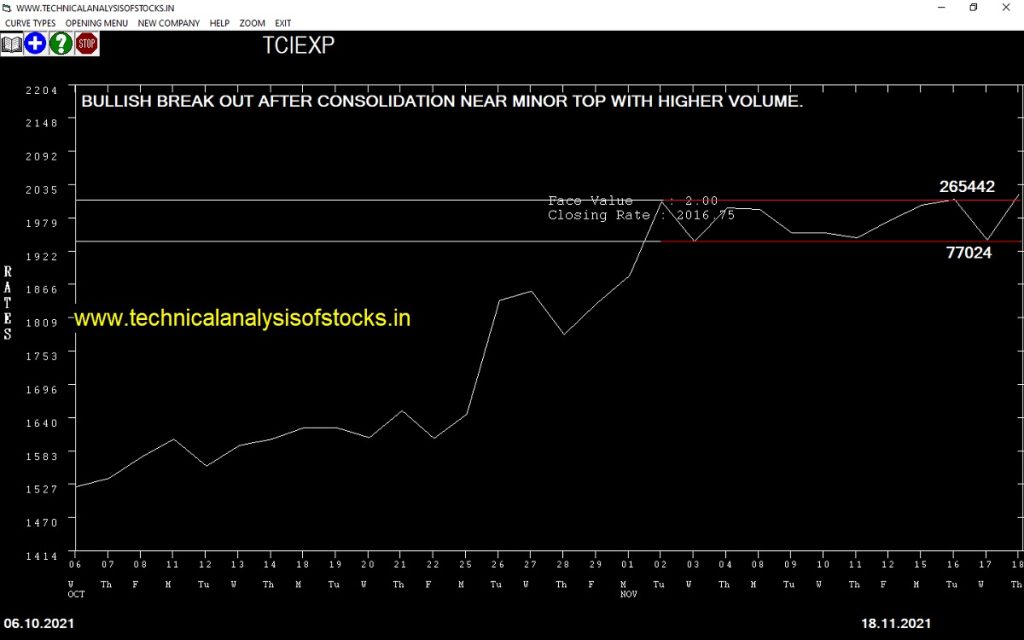
TCIEXP (NSE Code) Signal : Bullish break out after consolidation near minor top with higher volume. Buy Above : 2025 Stop Loss : 1970.10 Target : 2069.20 (Short term)
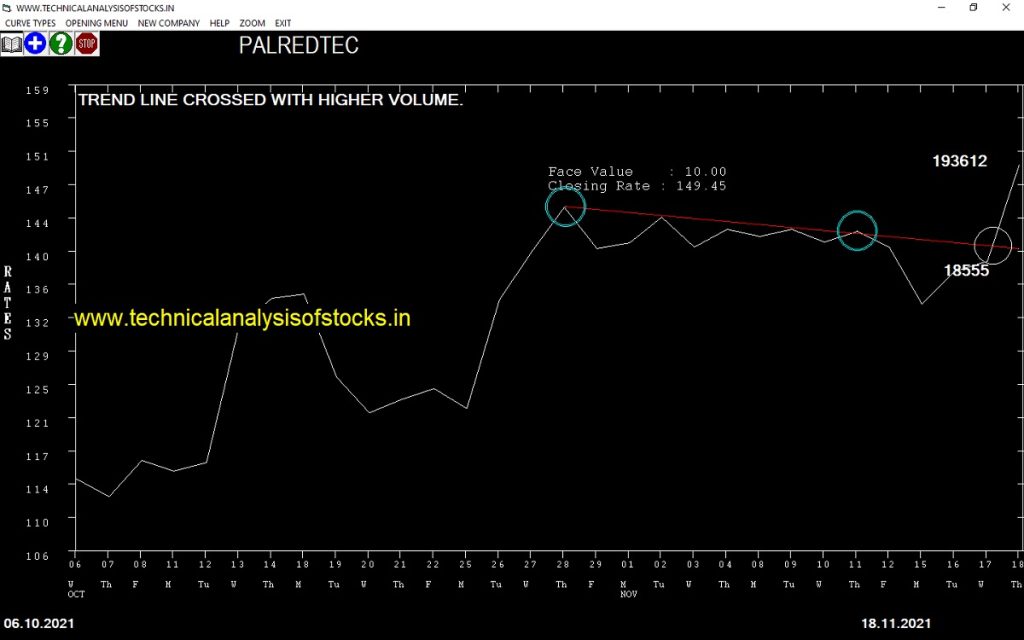
PALREDTEC (NSE Code) Signal : Trend line crossed with higher volume. Buy Above : 150.05 Stop Loss : 135.20 Target : 162.50 (Short term)
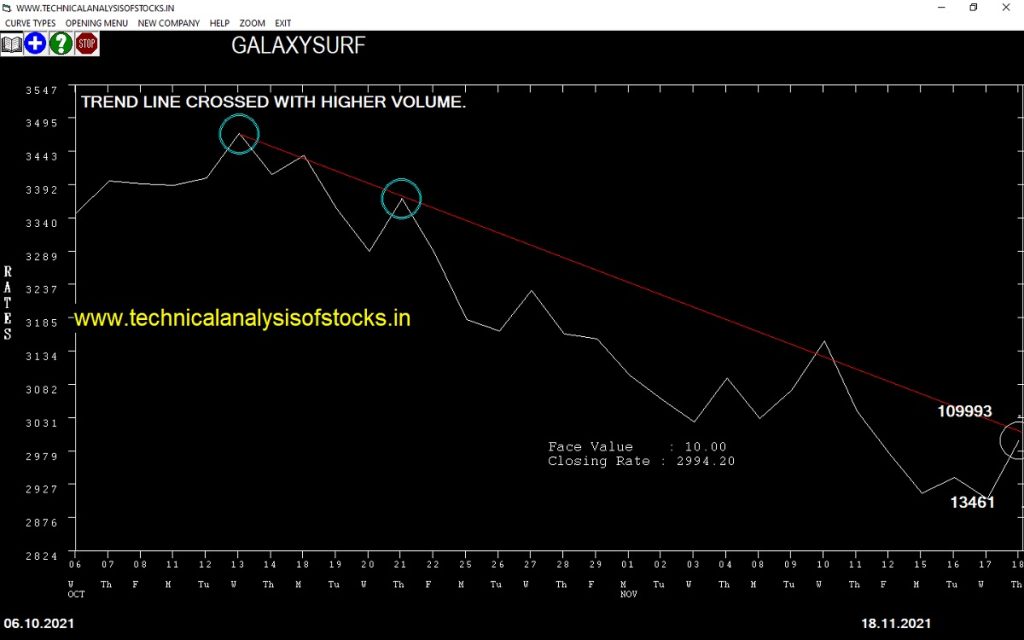
GALAXYSURF (NSE Code) Signal : Trend line crossed with higher volume. Buy Above : 2997.55 Stop Loss : 2931 Target : 3051 (Short term)
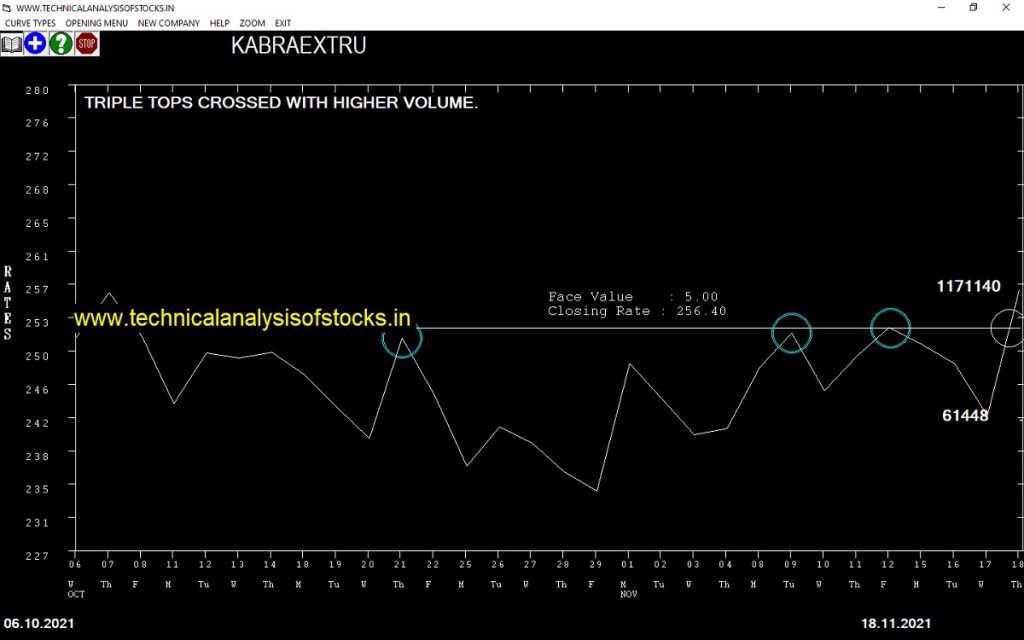
KABRAEXTRU (NSE Code) Signal : Triple tops crossed with higher volume. Buy Above : 260 Stop Loss : 240.40 Target : 276.25 (Short term)
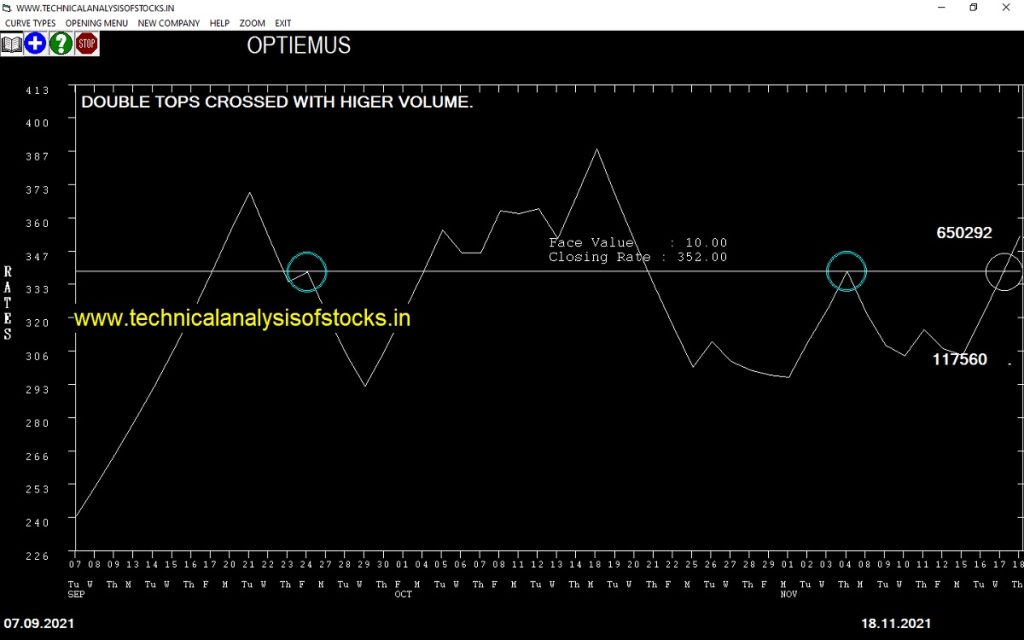
OPTIEMUS (NSE Code) Signal : Double tops crossed with higher volume. Buy Above : 356.25 Stop Loss : 333.25 Target : 375.20 (Short term)
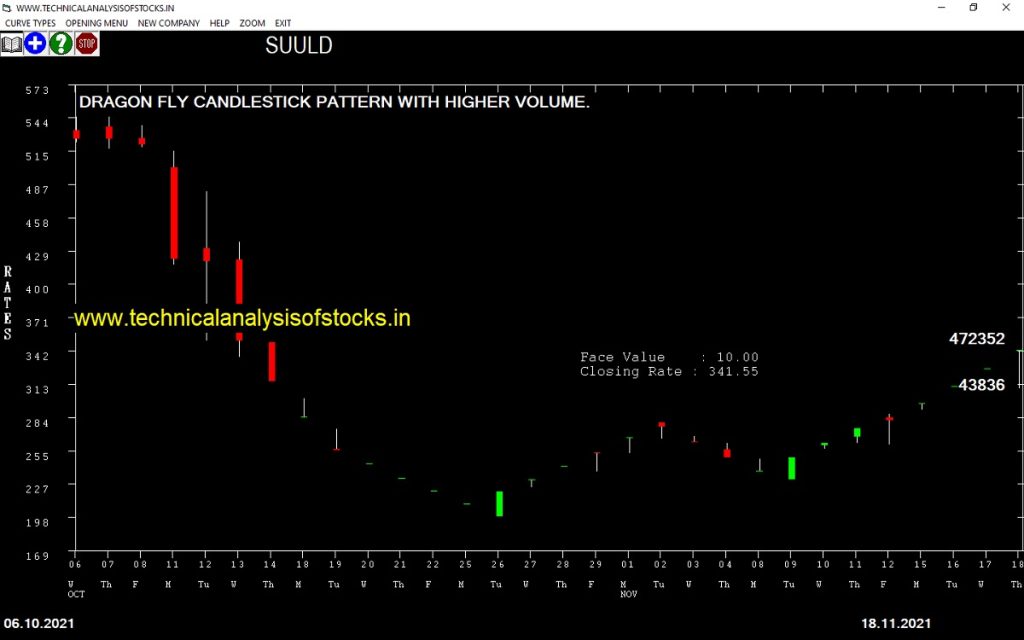
SUULD (NSE Code) Signal : Dragon fly candlestick pattern with higher volume. Buy Above : 342.25 Stop Loss : 319.70 Target : 360.80 (Short term)
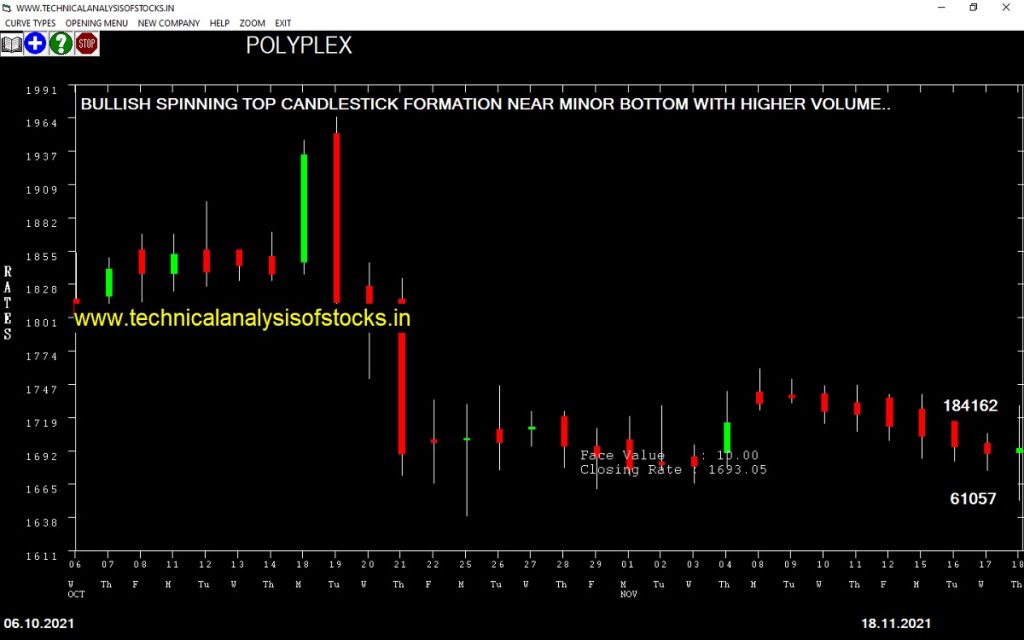
POLYPLEX (NSE Code) Signal : Bullish spinning top candlestick formation near minor bottom with higher volume. Buy Above : 1701.55 Stop Loss : 1651.20 Target : 1742.20 (Short term)
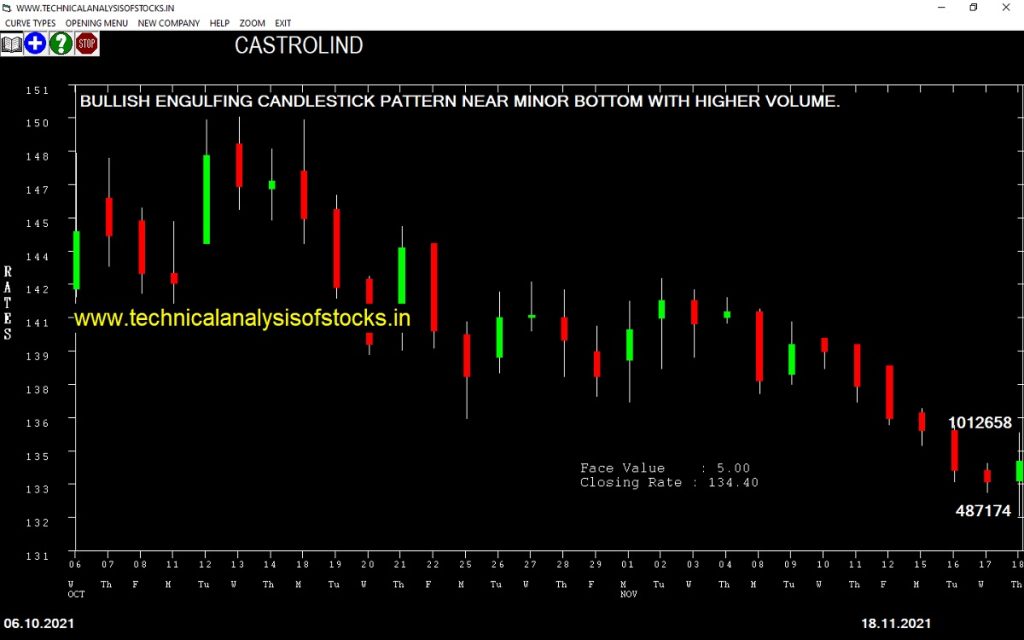
CASTROLIND (NSE Code) Signal : Bullish engulfing candlestick pattern near minor bottom with higher volume. Buy Above : 135.15 Stop Loss : 121.05 Target : 146.95 (Short term)
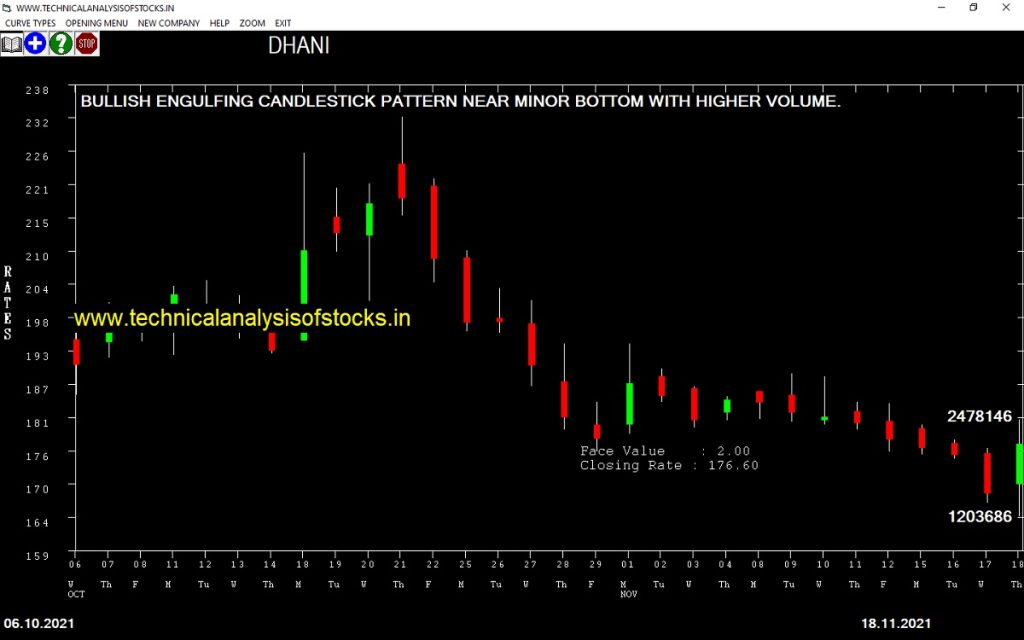
DHANI (NSE Code) Signal : Bullish engulfing candlestick pattern near minor bottom with higher volume. Buy Above : 178.90 Stop Loss : 162.65 Target : 192.40 (Short term)