STOCKS WITH BUY SIGNAL
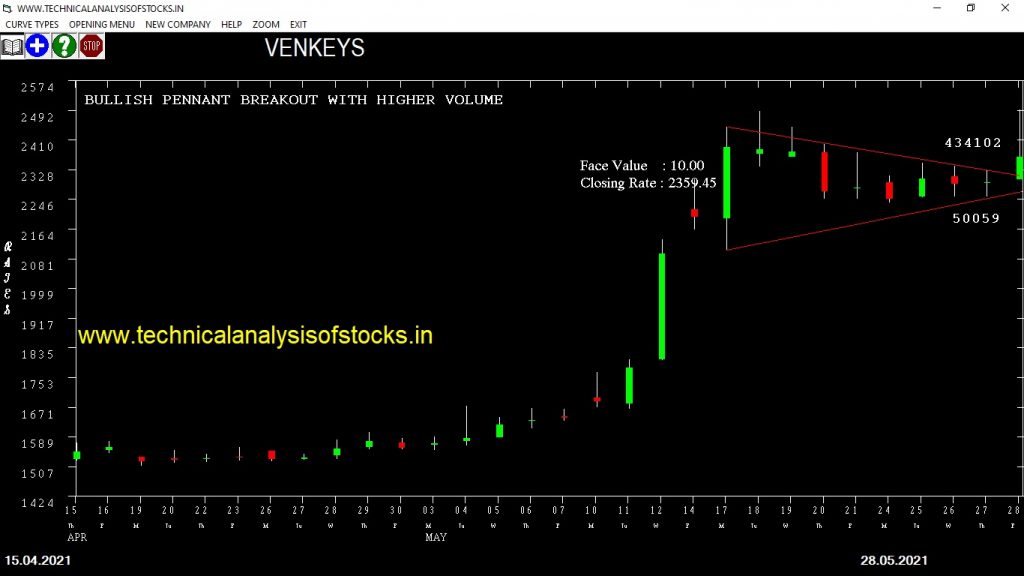
VENKEYS (NSE Code) Signal : Bullish pennant breakout with higher volume. Buy Above : 2364.40 Stop Loss : 2305.15 Target : 2412.05 (Short term)
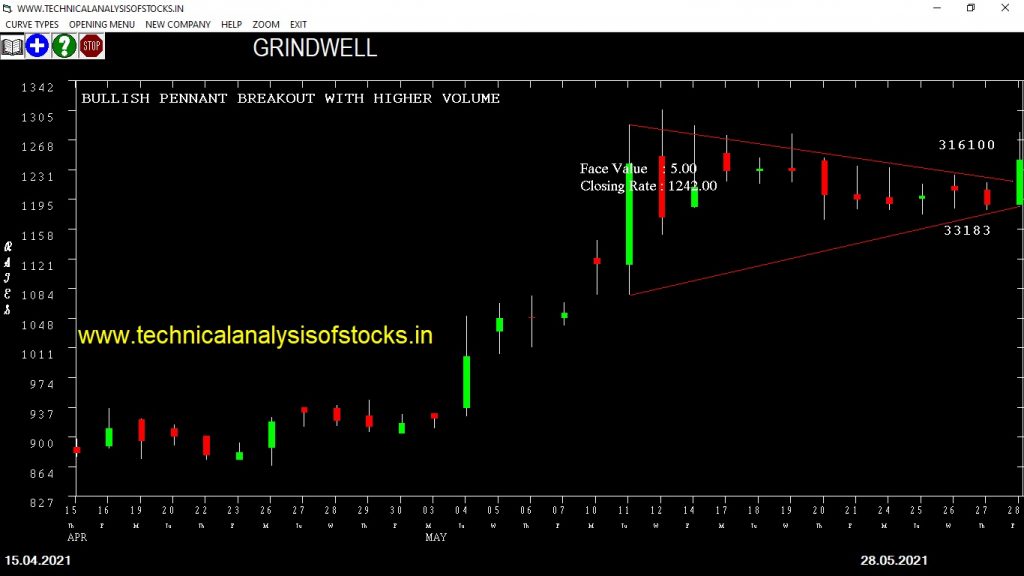
GRINDWELL (NSE Code) Signal : Bullish pennant breakout with higher volume. Buy Above : 1242.55 Stop Loss : 1199.50 Target : 1277.40 (Short term)
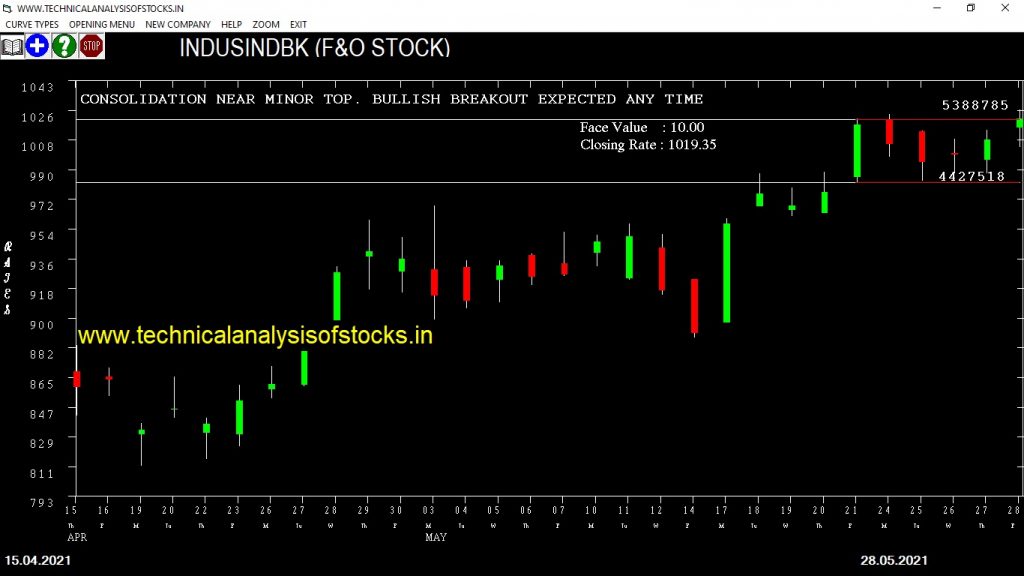
INDUSINDBK (NSE Code) Signal : Consolidation near minor top. Bullish breakout expected any time. Buy Above : 1024 Stop Loss : 984.90 Target : 1055.70 (Short term)
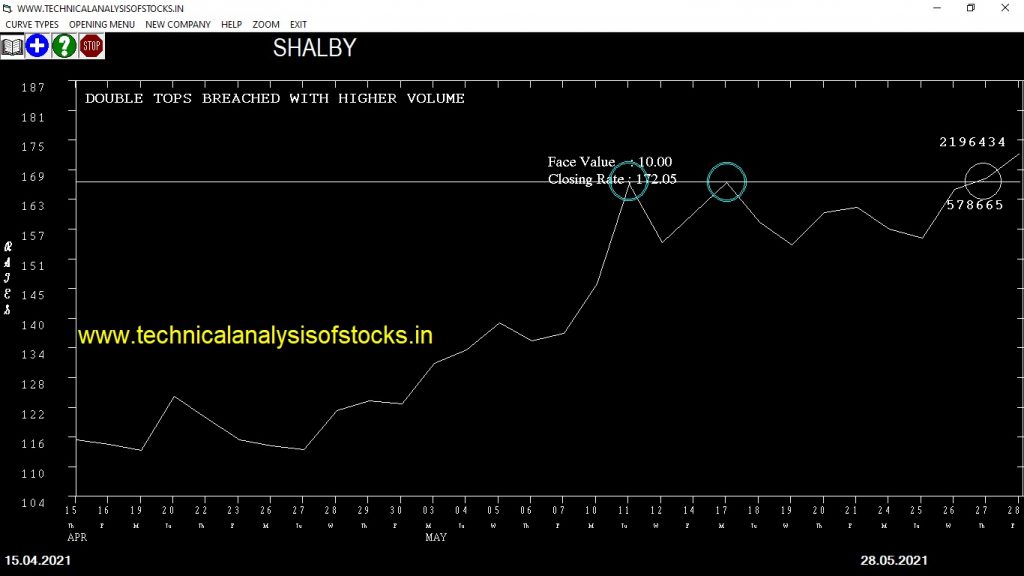
SHALBY (NSE Code) Signal : Double tops crossed with higher volume. Buy Above : 172.25 Stop Loss : 156.30 Target : 185.55 (Short term)
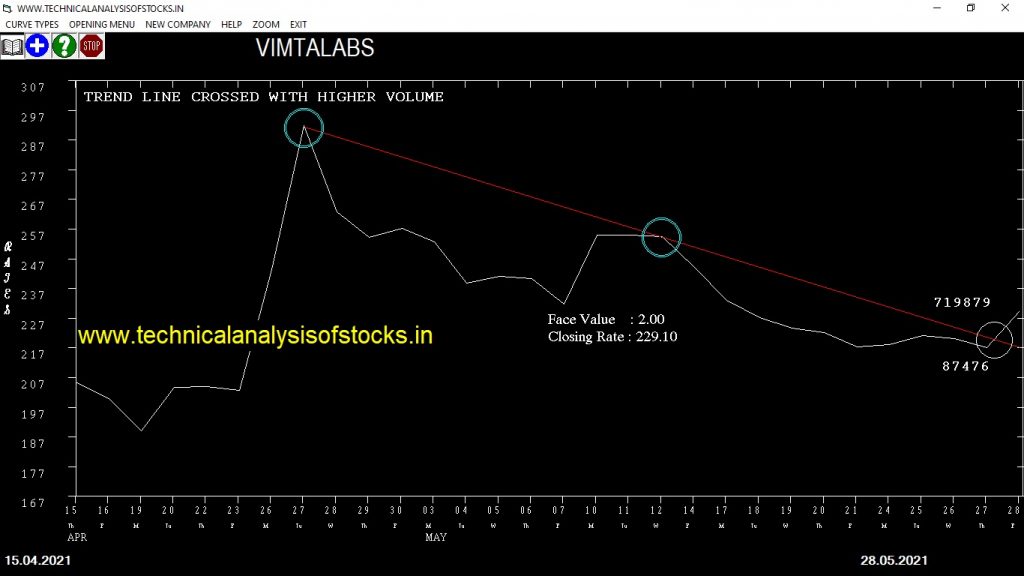
VIMTALABS (NSE Code) Signal : Trend line crossed with higher volume. Buy Above : 232.55 Stop Loss : 214 Target : 247.95 (Short term)
STOCKS WITH SELL SIGNAL
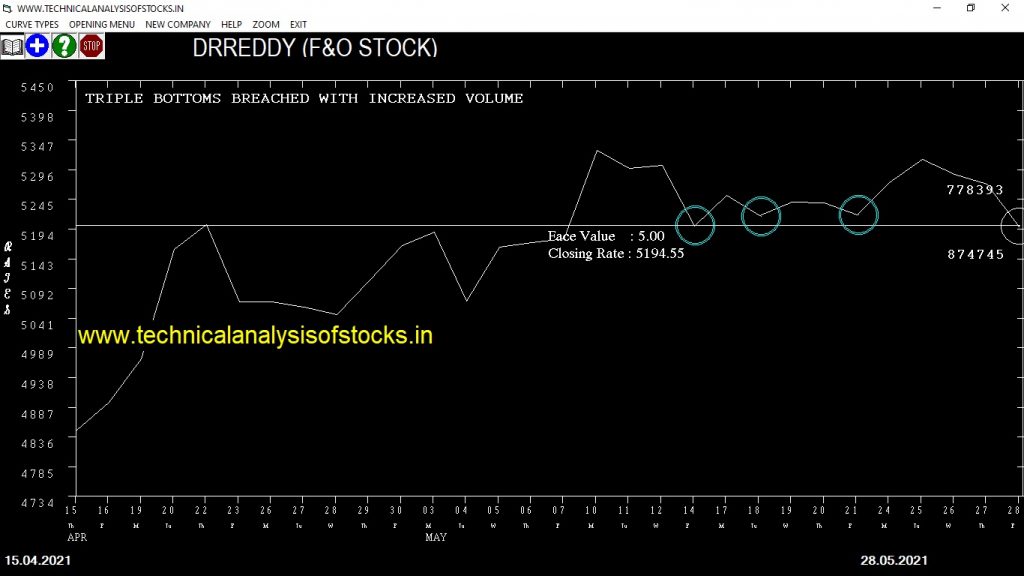
DRREDDY (NSE Code) Signal : Triple bottoms breached with increased volume. Sell Below : 5184 Stop Loss : 5271.75 Target : 5114.80 (Short term)
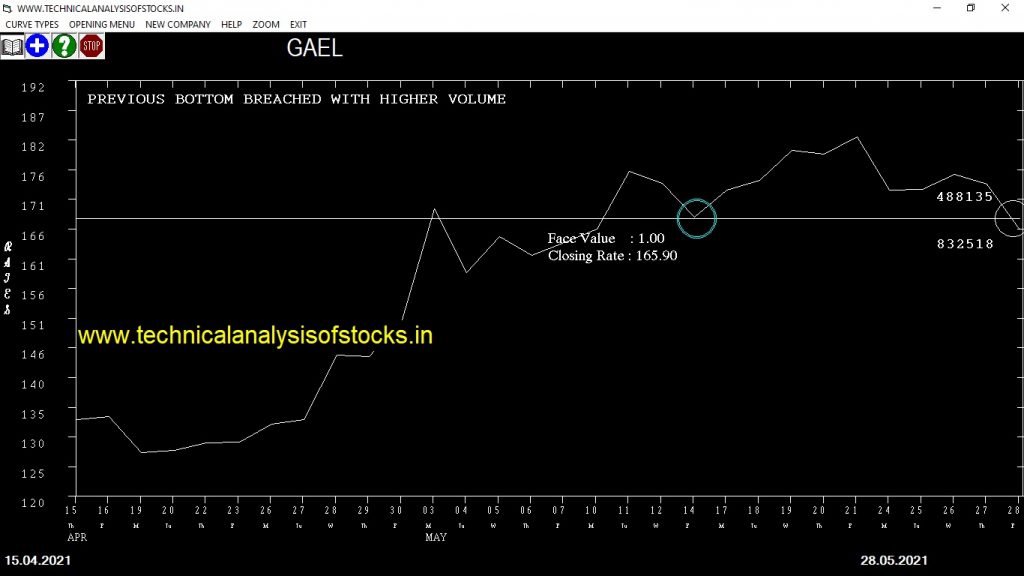
GAEL (NSE Code) Signal : Previous bottom breached with higher volume. Sell Below : 165.75 Stop Loss : 182.15 Target : 153.20 (Short term)
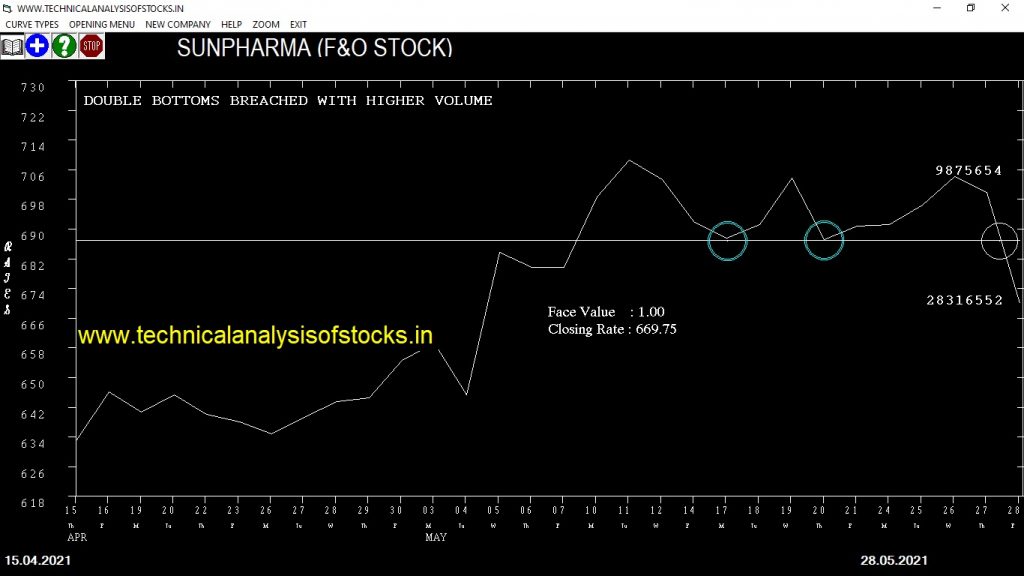
SUNPHARMA (NSE Code) Signal : Double bottoms breached with higher volume. Sell Below : 669.50 Stop Loss : 701.90 Target : 644.20 (Short term)
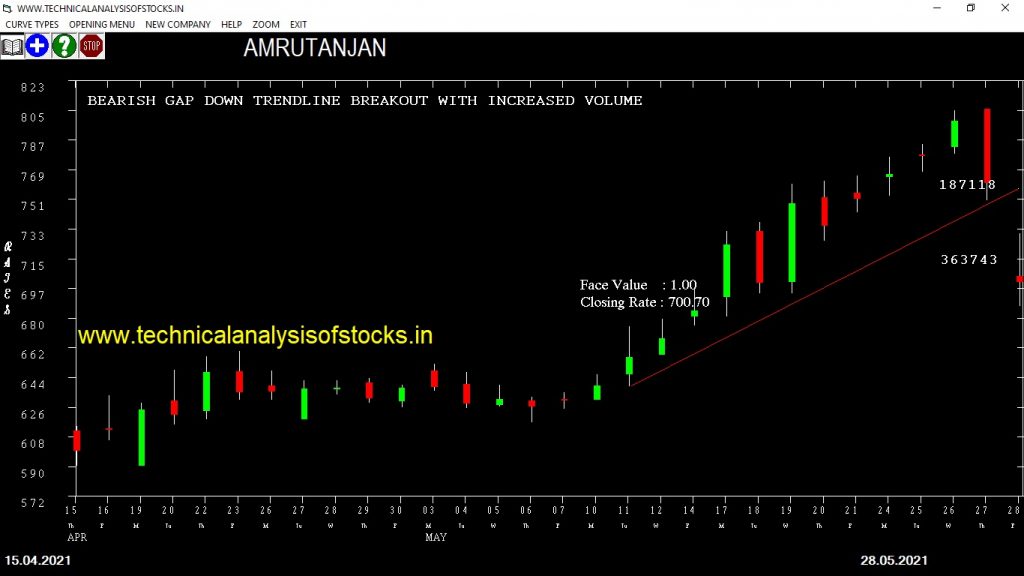
AMRUTANJAN (NSE Code) Signal : Bearish gap down trendline breakout with increased volume. Sell Below : 695.60 Stop Loss : 728.65 Target : 669.85 (Short term)
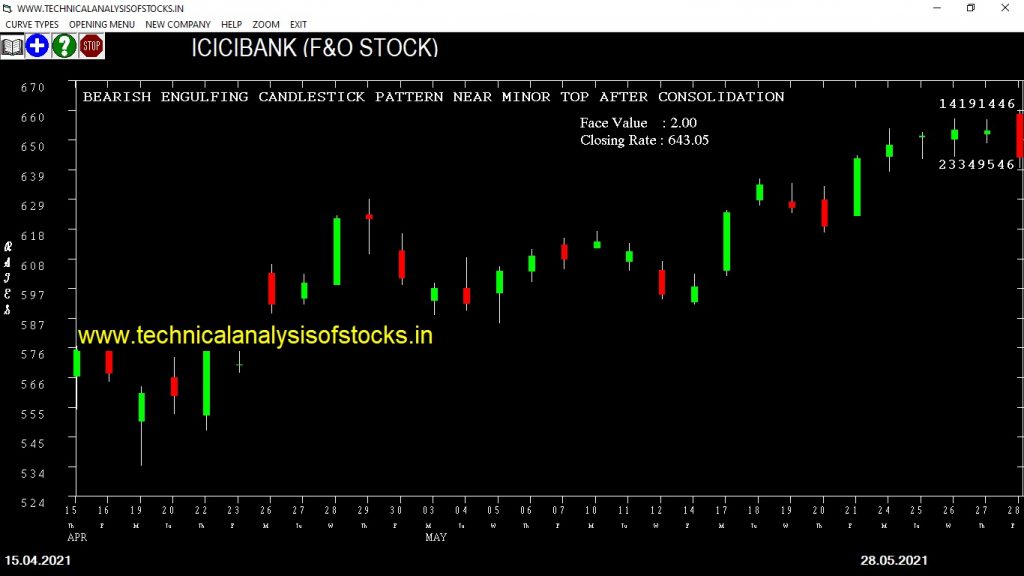
ICICIBANK (NSE Code) Signal : Bearish engulfing candlestick pattern near minor top after consolidation. Sell Below : 637.55 Stop Loss : 669.20 Target : 612.85 (Short term)