Technical analysis was started in the 1600s by Japanese rice traders who marked the price of rice on charts. With repeated use of these charts, it dawned on some of the traders that price patterns in the charts signaled the direction rice prices were likely to move in.
Price patterns are vital in technical analysis. In the 1920s Jesse Livermore talked about how analysis of price patterns had enabled him to make him millions in the stock market :
There is nothing new in Wall Street. There can’t be because speculation is as old as the hills. Whatever happens in the stock market today has happened before and will happen again.
Technical analysis uses a stock’s price history to decide whether it’s a buy, sell or hold. The volume – the number of shares traded – is also often included in technical analysis. Since we’re talking mainly about the “basics” of trading, we’ll talk mostly about the most important number in technical analysis, price.
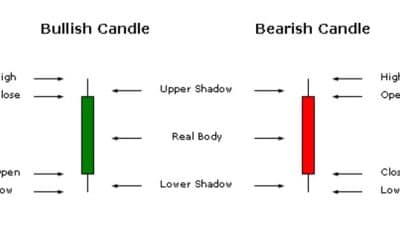
Technical analysts interpret rising prices to mean buyers are bidding confidently; buyers are doing this because they believe prices will rise further. This type of buyer is termed a bull. (Bulls attack by pushing upwards with their horns.)
When bulls have a lack of confidence in any market the result is falling or flat prices. When price falls become the norm, bears control the market. Bears believe prices will fall and, as a result, they are sellers. (Bears attack by pushing their prey to the ground.)
Technical analysis presumes that if there is momentum in a stock-price – that is, if its price has been trending persistently up for some time (or persistently down) – the momentum will reverse some time – but most likely not in the short term. So, if momentum is positive, you should be a buyer because positive momentum is a bullish signal. (Bulls are in control of the market.) Similarly, if momentum is negative, you should sell – negative momentum is a bearish signal.
Does Stock Market Technical Analysis Work?
No serious technical analyst would claim that technical analysis is effective in every trade. Some analysts look for a strategy that makes a profit on most trades. Making small profits on 60 to 70 percent of trades is possible. When these small profits are added up they can be significant, provided losses from losing trades are held in check.
Other technical analysts don’t worry so much about achieving a positive outcome in the majority of trades. Even if only 40% of trades are positive, they can still make a profit. It’s easy to see why this should be the case. Let’s say that in ten trades, a trader loses money in six and makes a profit in four. He makes an average loss of $200 per trade in the losing trades and an average profit of $800 in the winning trades.
Total losses = 6 x $200 = $1,200
Total profits = 4 x $800 = $3,200
Overall profit = $2,000
This sort of trading pattern lies behind the old trading dictum:
Cut your losses and let your profits run.
George Soros sums it up neatly:
It doesn’t matter how often you are right or wrong – it only matters how much you make when you are right versus how much you lose when you are wrong.
Provided your strategy can serve up good results on a minority of trades it can still be very profitable, provided you’re disciplined about selling when you hit a stop loss.
Unfortunately, as we’ll see in the section about personality, most people prefer to cut their profits and let their losses run!
John Mauldin reports that, in 1991, fund manager Gary Hirst began an extensive study of technical analysis. He looked at various forms of technical analysis such as Elliot wave, stochastics and chart patterns. Hirst found no evidence that these methods outperformed trading stocks at random.
Despite Hirst’s findings, William J. O’Neil’s CAN SLIM method is a highly successful stock strategy which relies on chart patterns.
Thomas N. Bulkowski has also amassed a great deal of evidence in his Encyclopedia of Chart Patterns showing some chart patterns are good predictors of bullish or bearish price action.
Low failure-rate patterns included, for example, Ascending Triangles (see image on right) and Descending Triangles.
Hirst did find one positive in his research – Markets produce profitable trends.
If you trade in the direction of the trend, you can profit from it.
You usually take your buy and sell signals from charts or from other technical indicators, such as a 200 day moving average of the stock’s price.
When the stock price is above the 200 day average, you buy. When the price falls below the moving average, you sell.
Well-known technical traders include:
- Bill Dunn, whose funds have produced a compound return of almost 19% a year between 1975 & 2010, and
- Paul Tudor Jones, whose career has been built on technical trading. He has amassed personal wealth in excess of $6 billion.
According to Jones:
I’m always thinking about losing money as opposed to making money. Don’t focus on making money, focus on protecting what you have.