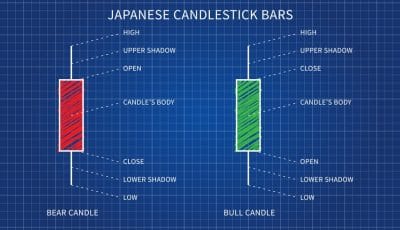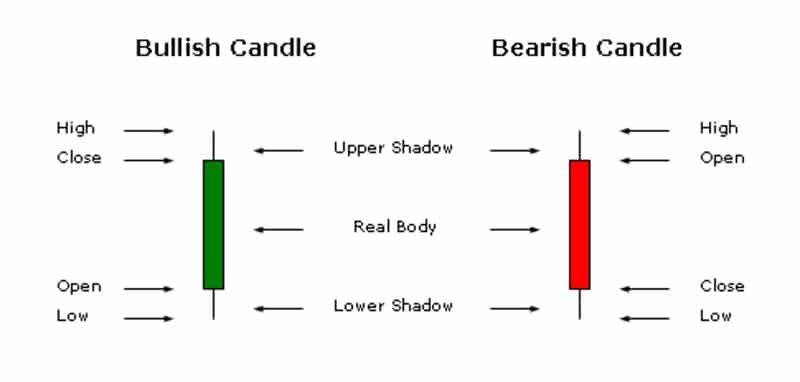
A typical candlestick is made up of a parts: the body and the shadow. A candlestick shows us a price bar with an opening price, a closing price, a high price for that time period and a low price for the same time period.
The body of the candlestick shows the open and close prices while the shadows on top and bottom of the body show the high and low price for that time period. The shadows looks like wicks and hence these are called candlesticks.
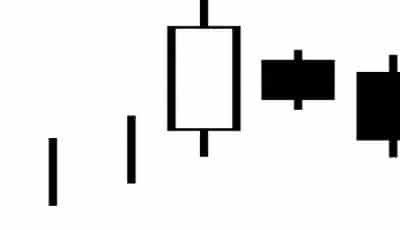
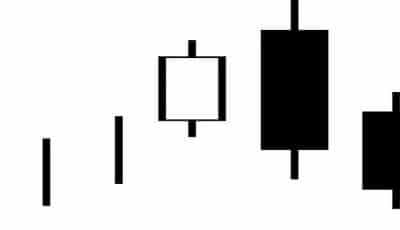
The color of the body of the candlestick determines if the candlestick is showing a bullish or bearish price movement. If the opening price is less than then closing price then the body of the candlestick is white (different software use different colors, with the typical being green or blue). The longer the white body, the more bullish it is. A very long white body or bar indicates that there was aggressive buying (greed) in that time period and in the end the bulls won.
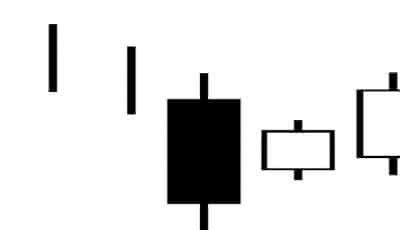
If the opening price is more than then closing price then the body of the candlestick is black (different software use different colors, with the typical being red). The longer the black body, the more bearish it is. A very long black body or bar indicates that there was aggressive selling (fear) in that time period and in the end the bears won.
There are two kinds of candlesticks: real body candlesticks and no real body candlesticks (also called as Doji). Candlesticks display a lot of information about the psychology of the traders trading that particular stock in that particular time frame. You can see the struggle between the bulls and bears and what the out come was. Based on this struggle and the recent history leading up to the pattern you are looking at, it is possible to some times predict accurately what the next price move might be.
All technical analysis is aimed at predicting price reversal.