Reading Bars
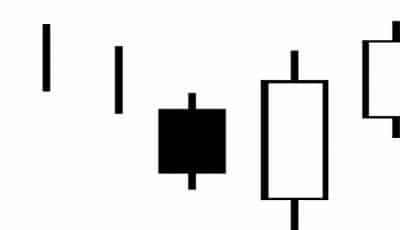
Reading bars is one of the most popular methods of charting and financial market analysis, second only to candlestick charting. This method is popular because the simple graphic depiction of the day’s trading makes it easy for traders to identify and predict trends. Here are the basics of reading bars.
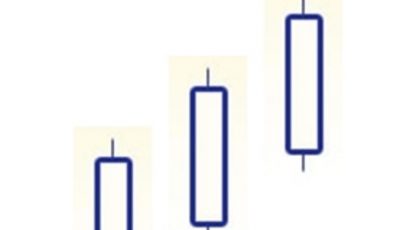
Know the time frame. A bar may represent a day, a week, or even five minutes.
Know what the vertical length of the bar represents. Generally, the length of the vertical bar itself indicates frame’s highs and lows, also known as the range of the bar.
Know what the horizontal lines mean. Usually, the a bar will show the opening and closing prices of the market during the given time frame, often with the two prices in different colors.
Know the direction of the bar. This can be gathered from the relationship between the opening and closing price. If the opening price is lower than the closing, then the bar and the market are both moving in an upward direction; if the closing price is lower than the opening, then there is a general downward direction.
As you can see, reading bars is actually very easy. Because no analysis is needed, bars can be produced in very short time intervals, even immediately with the use of software programs designed for this purpose. For this reason, many traders use either bars or candlesticks to identify common patterns so they can act before upturns or downturns actually occur.
Chart Indicators
Chart indicators are patterns or moves that a trader uses to gauge future movement in the stock market. These may be based on a stock’s opening price, closing price, or the volume of trading between the two points. Most analysts have a few favorite indicators that they particularly trust and thus rely heavily upon.
Chart indicators basically give traders that watch them an indication of the direction of prices in the future. They may indicate prices increasing, decreasing, or stagnating. Based upon this, traders may buy or sell the stock in question to maximize their profit. Here are a few indicators that are watched for by many traders.
RSI: The Relative Strength Index compares the rise and fall in prices to past performance. This is one of the more common indicators.
Stochastic Oscillator: This indicator compares the closing price of a commodity to the price range of a specific time period. The price range can vary depending on which time interval you choose, and thus so can this indicator.
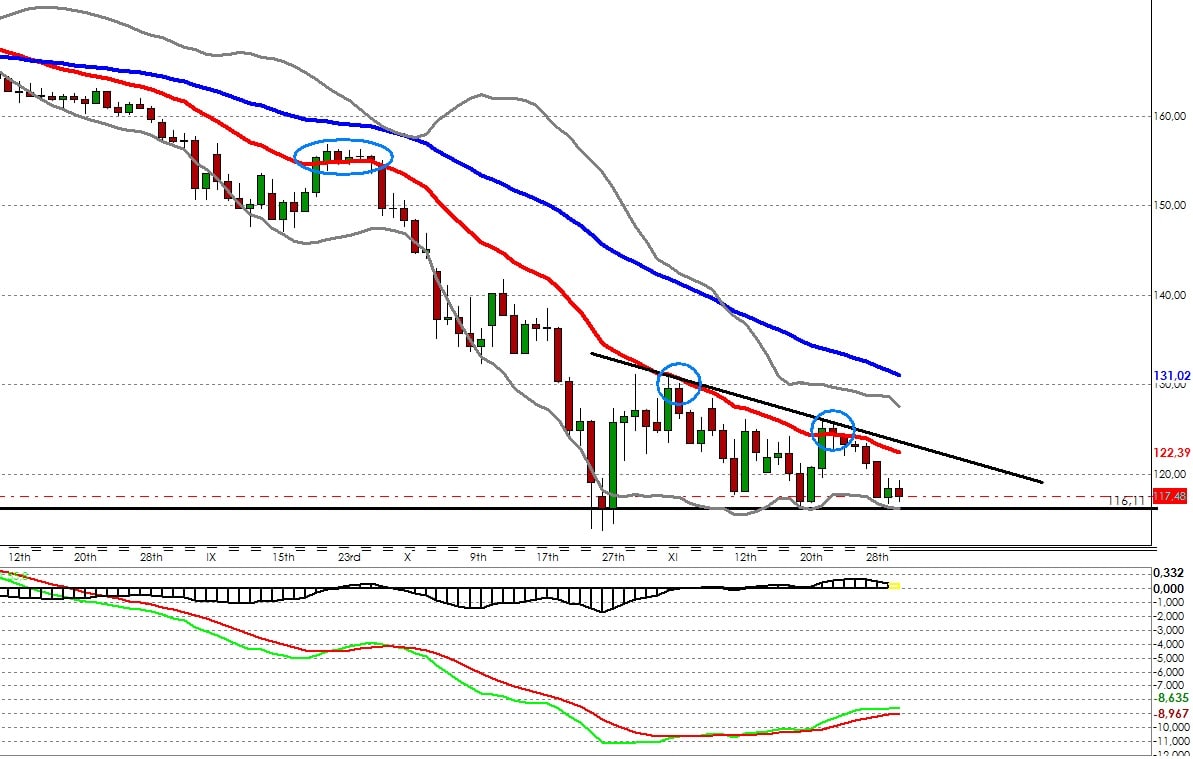
Moving Average: This indicator attempts to distill important information by taking several different averages of several different sets of information.
MACD: This stands for Moving Average Convergence/Divergence and uses the moving average information to form a line against which real time stick information is compared. This often can pinpoint trends before they happen.
These are just a few of the indicators commonly used by stock analysts. As you can see, there are many chart indicators, each with its own benefits and drawbacks. Deciding which are best for you is a very personal decision, but one that every trader must make in order to find success in a competitive market.