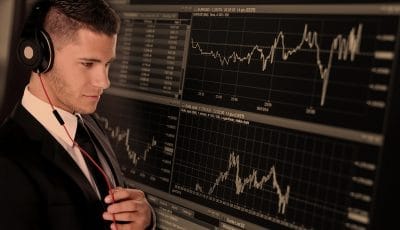
If you are trading or thinking of getting into trading, Technical Analysis or TA is a very important part of the process. With out looking into Technical Analysis and understanding TA, it would be very difficult to be profitable in your trading sessions.
Technical Analysis is made up of a whole load of tools, including analyzing charts of the movement of price of a given stock over a period of time. Using these charts to predict the future price of that stock is what technical analysis is all about.
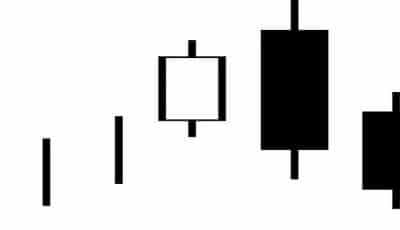
There are various methods of representing the price and time data on these charts such as lines, bars etc. But a new method, called the “Candlesticks Charting”, based on a Japanese system, was brought to the west in the 1900 by Charles Dow.
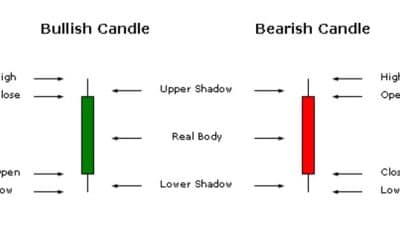
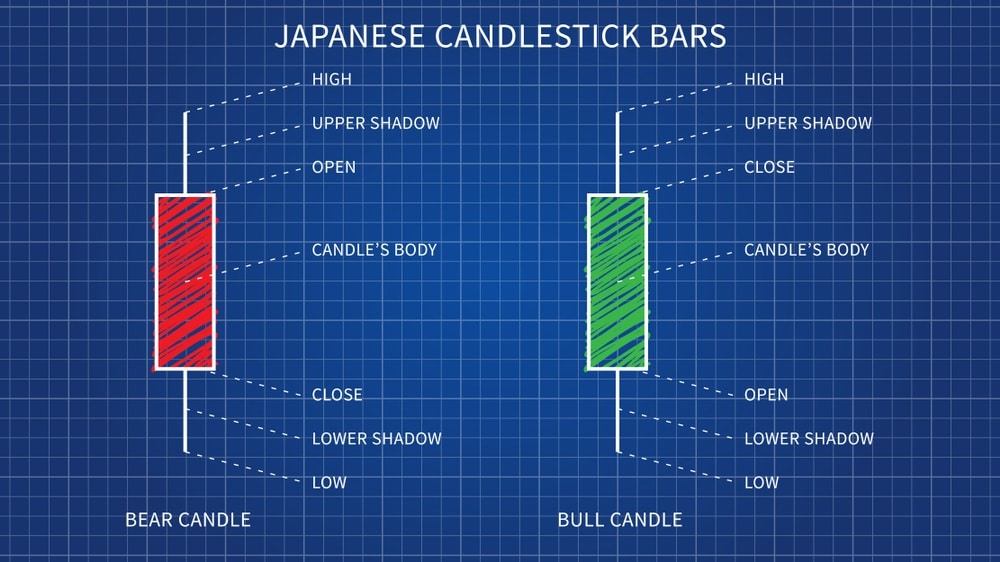
Over 150 years ago, a Japanese rice trader names Homma Munehisa is credited to have come up with a system of charting that used candlesticks giving an overview of open, high, low, and close market prices of rice over a certain period. Until about 1710, only physical rice was traded but then a futures market emerged where coupons, promising delivery of rice at a future time, began to be issued. From this, a secondary market of coupon trading emerged in which Munehisa flourished. Stories claim that he established a personal network of men about every 6 km between Sakata and Osaka (a distance of some 600 km) to communicate market prices.
The system that Homma created to help him analyze the price movements of rice back in the 18th century became popular in the 1990s, largely thanks to Steve Nison, who tracked down and translated a huge collection of Japanese texts that described the Candlestick charting method. Today, almost every one knows about the candlestick charting method and almost all trading and analysis software display candlesticks and even name and explain the candlestick patterns and formations.